
This is a sequel of my post about diagnosing 3D print quality when printing with Octoprint.
Now that we have a working theory for the reduced print quality, the next step was to know for sure when the problem was occurring. If I could have the printer tell me when it has no more instructions, it would be the first step to be able to objective measure how often the issue was occurring.
I dived into the source code for Marlin to begin understanding where I can hook into the relevant events, and what kind of metrics I could easily extract.
I consider myself mediocre with C/C++, and it's extremely rusty at best, and embedded C/C++ has its own shenanigans, so I may be wrong about how stuff works.
Understanding what to change
Marlin's core loop is as follows:
/**
 * The main Marlin program loop
 *
 *  - Call idle() to handle all tasks between G-code commands
 *      Note that no G-codes from the queue can be executed during idle()
 *      but many G-codes can be called directly anytime like macros.
 *  - Check whether SD card auto-start is needed now.
 *  - Check whether SD print finishing is needed now.
 *  - Run one G-code command from the immediate or main command queue
 *    and open up one space. Commands in the main queue may come from sd
 *    card, host, or by direct injection. The queue will continue to fill
 *    as long as idle() or manage_inactivity() are being called.
 */
I traced BUFSIZE to queue.cpp, where the logic for reading off serial comms and the command queue is handled. This is how I think it works:
idle()(this seems poorly named?), callsmanage_inactivity(), which in turns callsqueue.get_available_commands()if there's enough room inGCodeQueue::command_bufferwhich has maxBUFSIZEelements.queue.get_available_commands()pulls data from serial / SD card, performs basic parsing, checksum validation, early handling- If it's all good and it doesn't need to handle it early, it chucks it in the
command_bufferring buffer via_enqueue, withsay_okflag for that index set totrue. - The
say_okflag is set in another array and not immediately sent to the host, which is not what I expected. - Other core tasks are run, such as timer checks, UI, auto-reporting, etc
- Finally,
queue.advance()is called, which invokesprocess_next_command(), which parses and executes the command process_parsed_command()is a behemoth of a switch statement, which figures out what function to run based on the gcode- Once it runs the relevant function, by default, it will call
queue.ok_to_send(), which then sends theokback to the host that Octoprint is waiting for.
While trying to understand how the core loops worked, I spotted the ADVANCED_OK block that exposes the planner and command buffer capacity, which were planner.moves_free() and BUFSIZE - [queue.]length, which is a great start to report.
The problem with understanding buffer underruns with the ADVANCED_OK report, is it can only report the state of those buffers when the ADVANCED_OK is sent. We can infer if it returns B(BUFSIZE - 1)that the command buffer was empty before we sent the command, but we don't have much other information from this.
I considered adding more instrumentation to the ADVANCED_OK response, however it would increase serial comm load on both ends cause it's called on every command, so I figured I needed to add my own gcode that can report the data I wanted, optionally on an interval.
Implementing a buffer monitoring gcode
I looked at the existing gcode list to see if there was anything similar to what I wanted to expose already, but there didn't appear to any I could easily extend. I decided to use M576, as M575 was "Set baud rate", which was somewhat relevant to buffer monitoring.
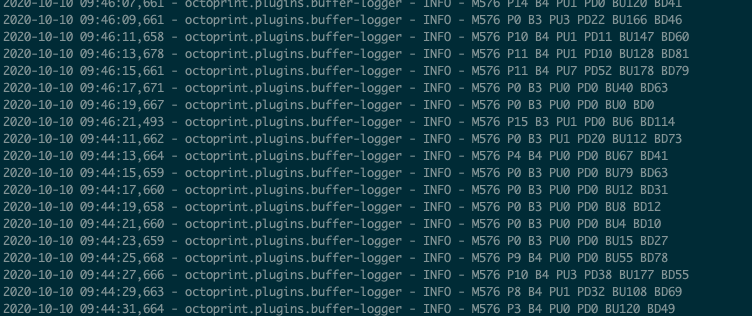
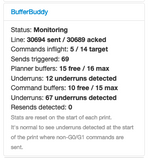
I used the auto temperature reporting module as a base, and hooked into GCodeQueue::advance() for my logic. A few iterations (which annoyingly requires me to flash via microSD), I had a working M576 command that returns M576 P<nn> B<nn> U<nn>, where:
Pis planner buffer availableBis command buffer available (both fromADVANCED_OK)Uis number of command buffer underruns since last report
It also supported M576 S<n> where n is the number of seconds between automatic reports.
Testing the concept
I ran it through a dry-run version of a half-scale 3DBenchy gcode, where all the extrusion instructions were stripped out, and combined with a simple Octoprint plugin I had hacked together, I was able to observe the output of my newly minted gcode command!
Initial findings showed that there was many underruns when printing through Octoprint, anywhere from 5-30 per second. I realised it's not the number of buffer underruns that would be the issue, but how long the queue was in an empty state.
Iterating and adding more metrics
I added M<nn> to represent the maximum time in milliseconds that the command buffer was empty between commands. This resulted in much more useful information regarding on how long Marlin may be waiting for a command.
However, I noticed when the max buffer empty time was as high as 100ms, the planner buffer generally remained full, which would mean that the printer would still have movement queued and thus not actually manifest in stalled motion.
I decided to also add planner buffer underrun metrics. This was more difficult to try to figure out where to make the change, as ideally we would detect if the queue was empty immediately after it was to be processed, however this logic was in a dedicated stepper ISR (some kind of interrupt handler) and it seemed like a bad idea to modify that, so I settled for hooking it into the auto_report_buffer_statistics that runs in a fairly tight loop.
I changed the output to the following:
 * When called, printer emits the following output:
 * "M576 P<nn> B<nn> PU<nn> PD<nn> BU<nn> BD<nn>"
 * Where:
 *   P: Planner buffers available
 *   B: Command buffers available
 *   PU: Planner buffer underruns since last report
 *   PD: Maximum time in ms planner buffer was empty since last report
 *   BU: Command buffer underruns since last report
 *   BD: Maximum time in ms command buffer was empty since last report
Now we can tell when and how long the motion planner buffer was empty for!
Testing methodology
To compare, I sliced a half-scale 3DBenchy with the same custom profile in both Cura 4.6.2 and Cura 4.7.1, as I know from personal experience that Cura 4.7 introduced a bug where it generates extremely dense gcode around curves.
Cura 4.7.1 generates as much as double(!!) the amount of gcode for the same model and settings, which definitely will cause issues if Octoprint is unable to stream the gcode to the printer to be printed at the speed that it was designed to be printed at.
I ran it through my dry-run.rb and "printed" these with M576 reporting every 2 seconds and chucked it into a log file for later processing.
I processed the logs into CSV and chucked it into Numbers to visualise the difference.
The results
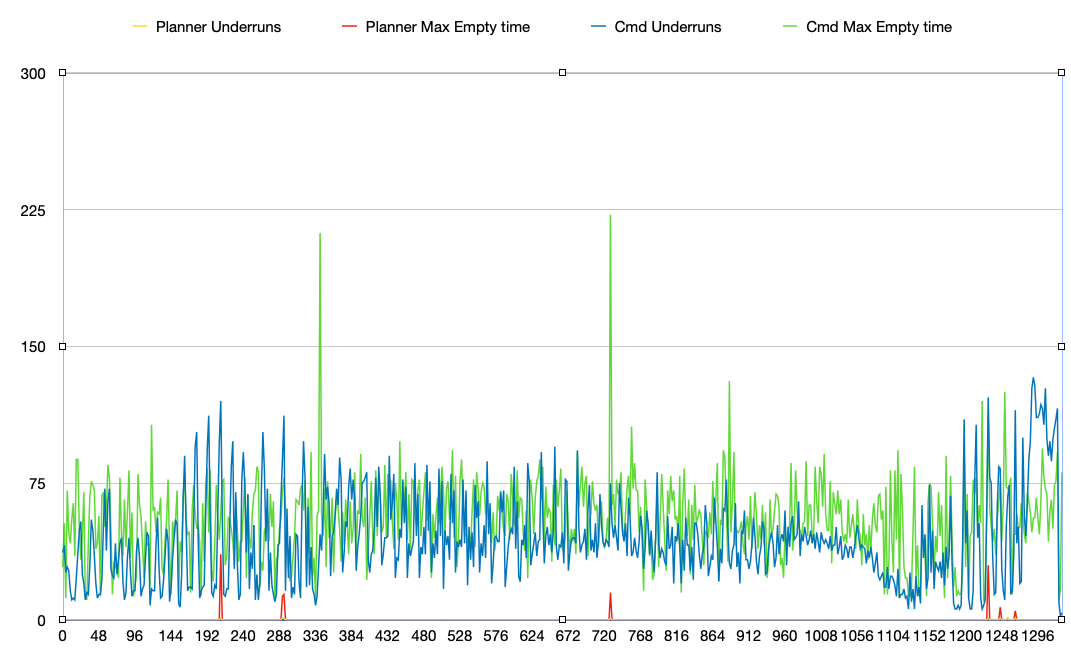
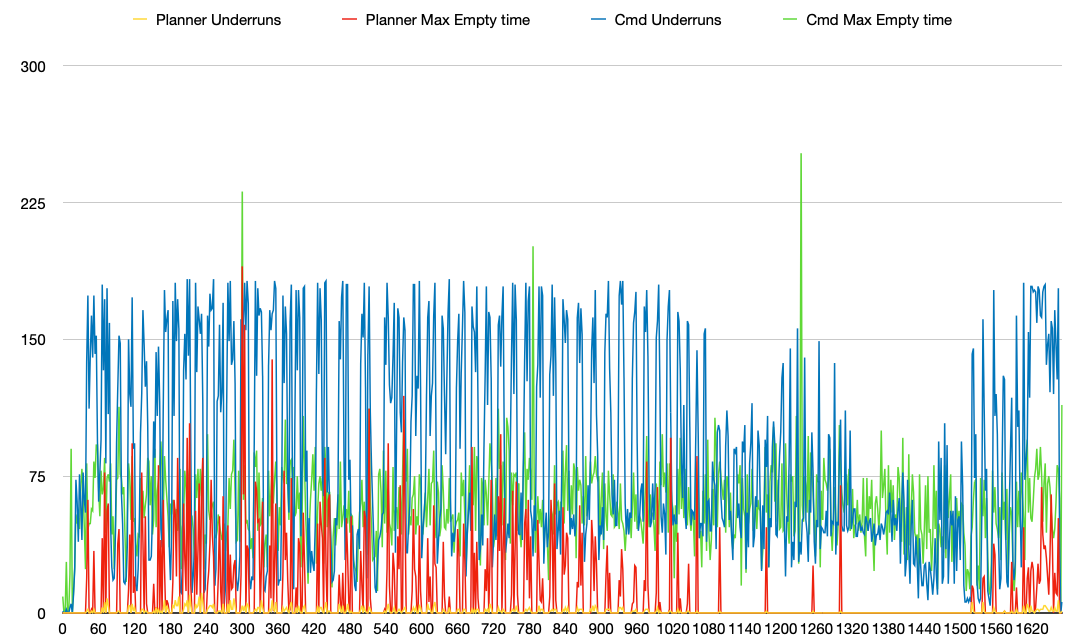
The key metric here is Planner Max Empty time, represented in red and is in milliseconds, followed by Planner Underruns in yellow as a count.
In Cura 4.6.2, we see only 9 instances of planner buffer underruns, and the max time the buffer was empty was 36ms.
However, 4.7.1 is a whole 'nother story, with 200+ planner buffer underruns.
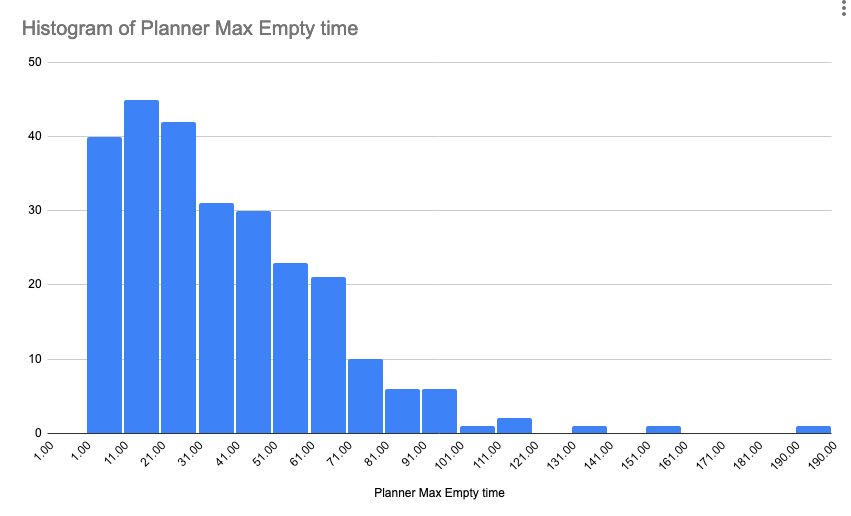
I'm not sure of the threshold where the motion planner buffer being empty results in visible print artifacts, but I feel like anything over 50ms is noticeable. Theoretically it should be able to test this by injecting pauses but that's for another time.
Next steps
Now that we have the ability to have some hard data when the motion planner buffer underruns, we can now attempt to address the issue and measure if it helped or not.
I'll be opening a pull request for the M576 gcode into Marlin.
Stay tuned for the next one!


Comments